
Improvement
Redesigned Overview in the Hardware Portal
See your fleet's performance and driver satisfaction at a glance, for the last 7, 30 or 90 days.
- Stage
- Live
- Released
- Product
- Hardware Portal
- Posted
What changed
The Overview in the Hardware Portal has a new layout with three tabs, Performance, Models and User satisfaction. One period switch sets the trend cards and the rating figures to the last 7, 30 or 90 days.
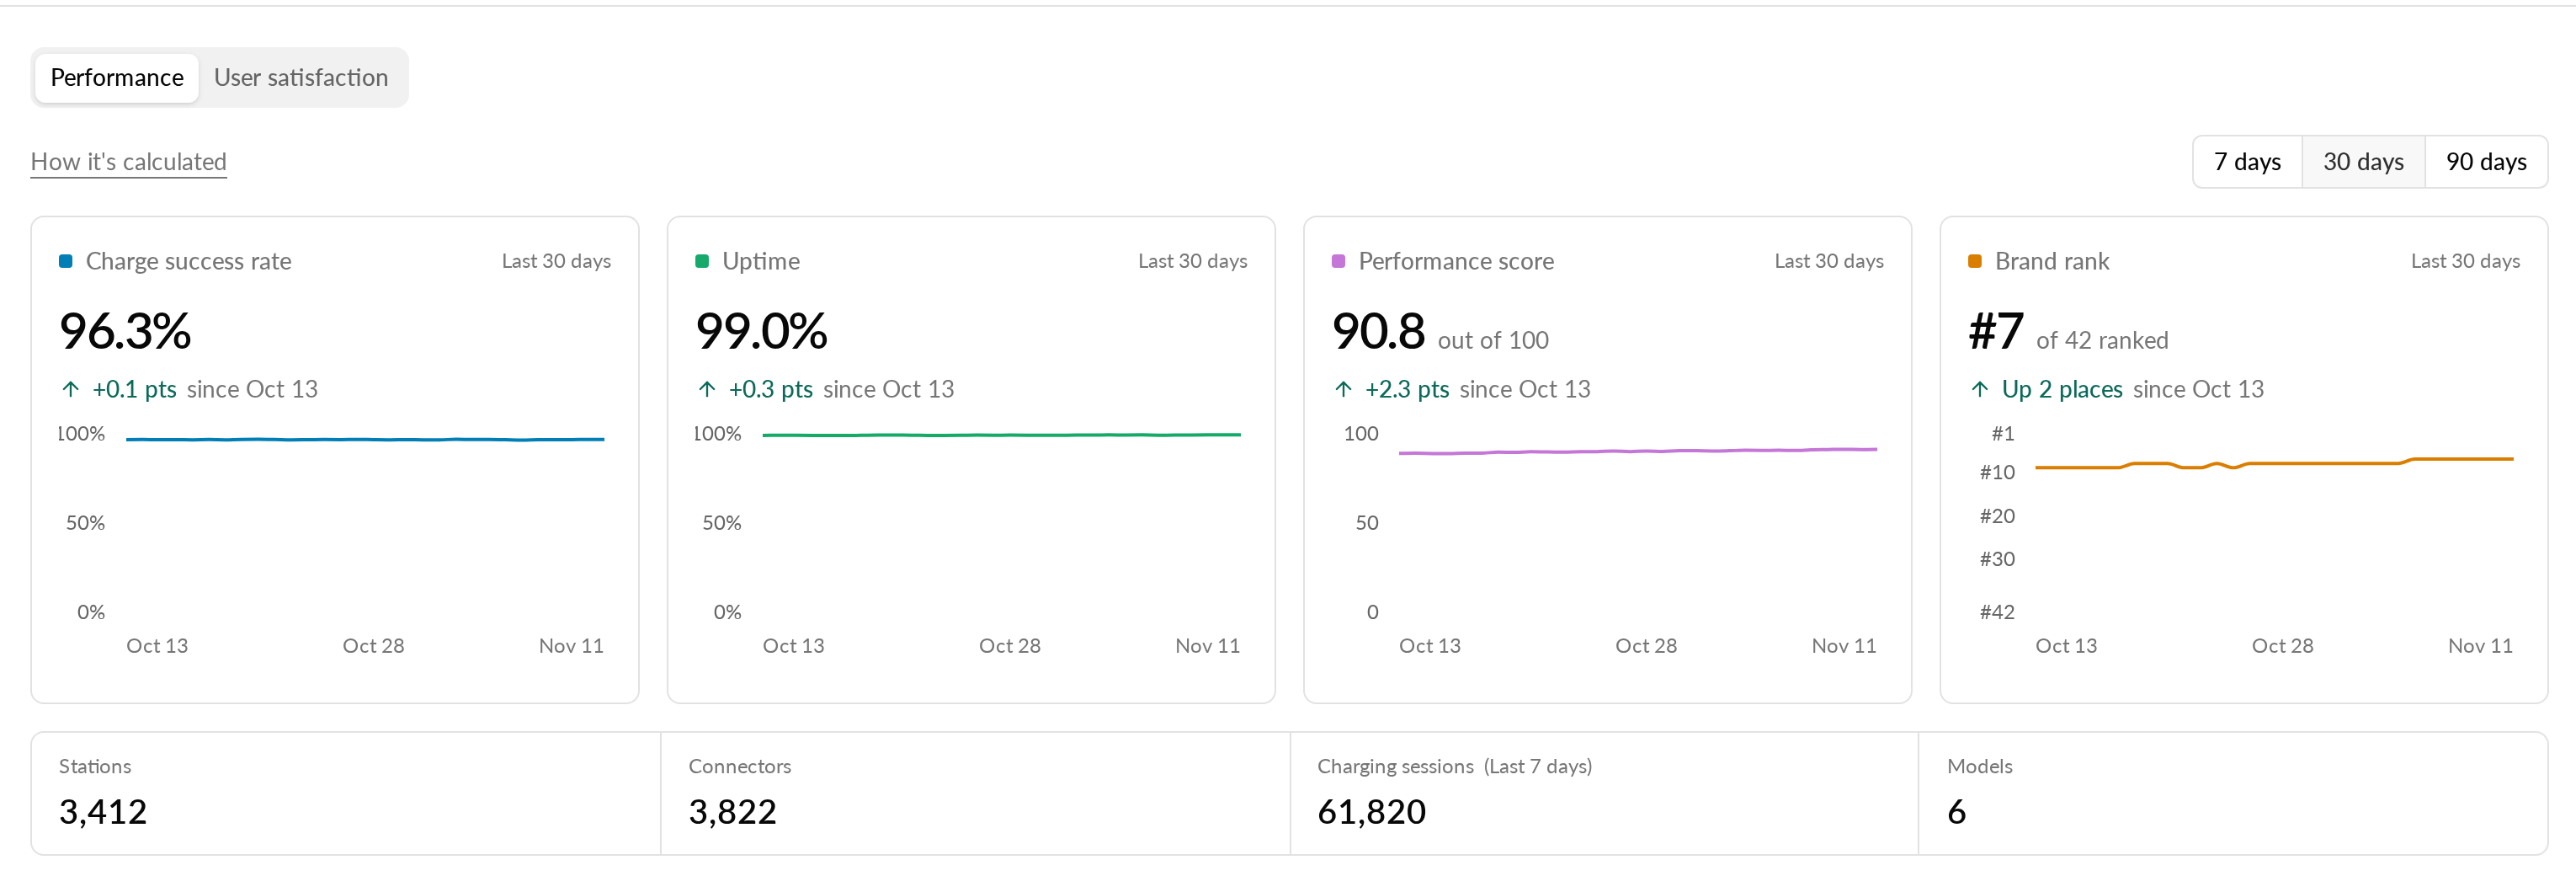
- Performance shows trend cards for charge success rate, uptime, performance score and brand rank, your fleet footprint, a Needs attention card with the models that trail your brand average, and a Fleet growth chart you can switch between stations and connectors.
- A Breakdown table lists every model, or every operator with their logo. Open an operator row to see its models.
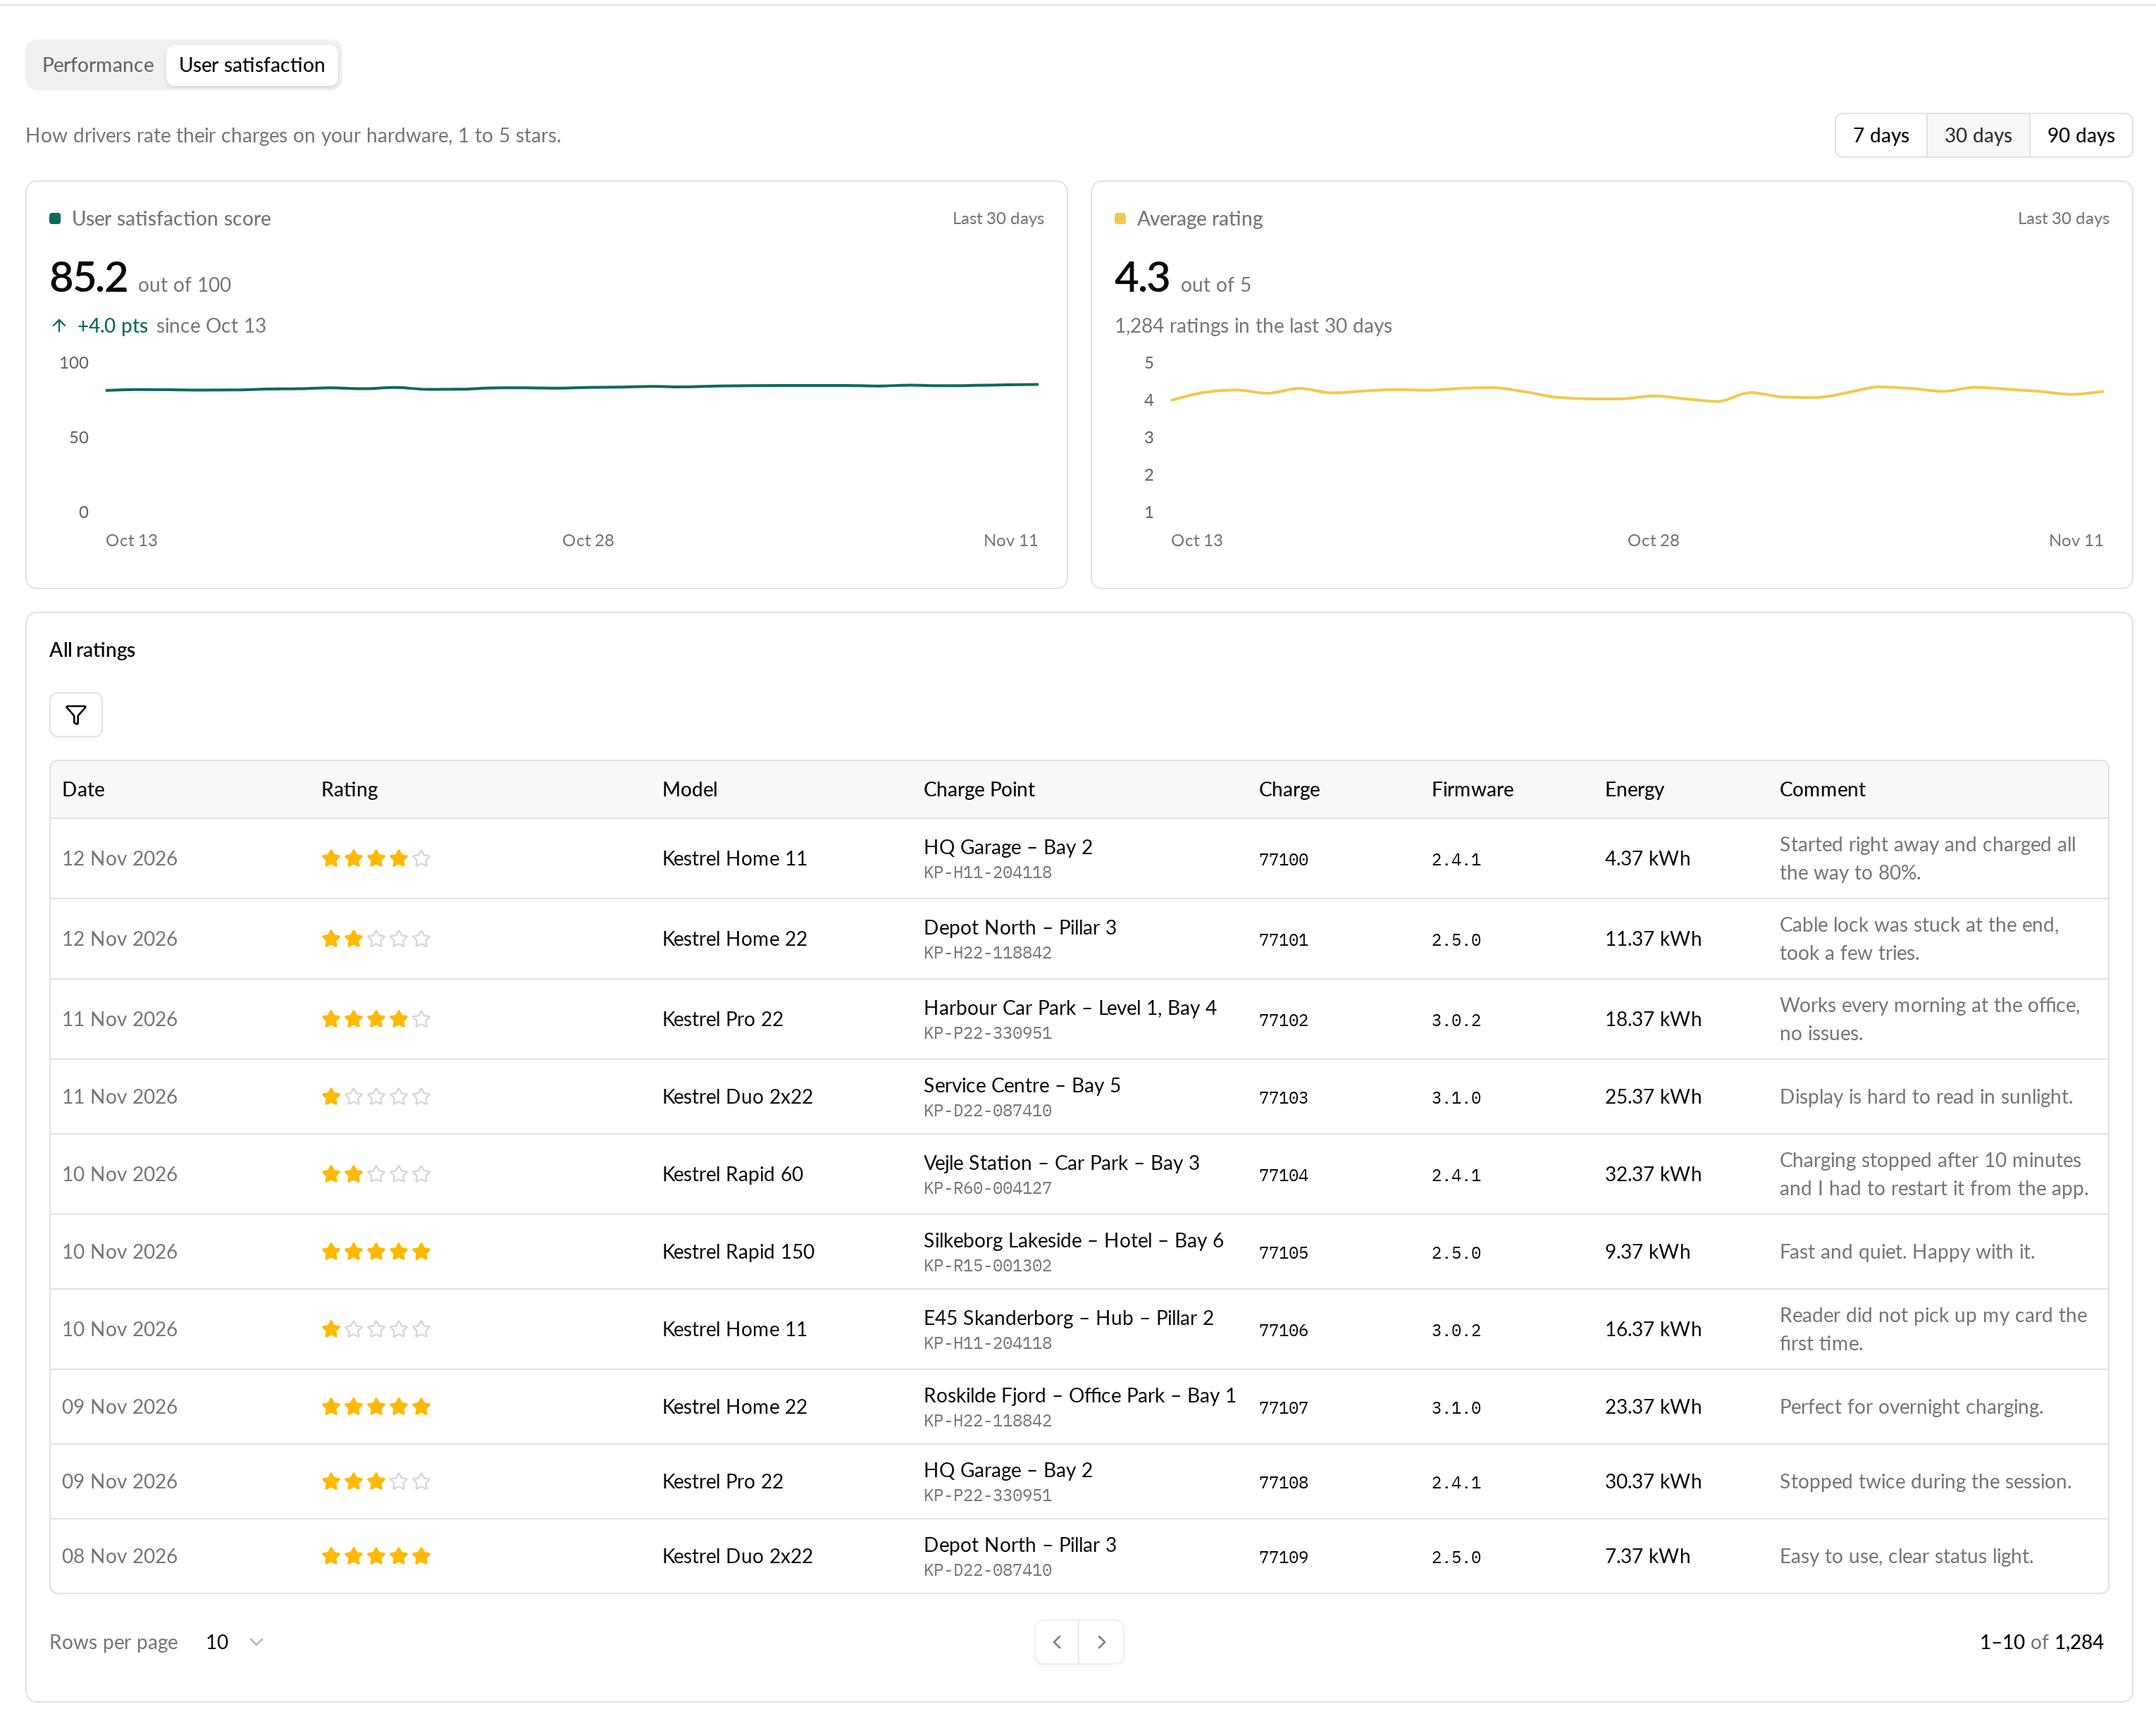
- User satisfaction shows your user satisfaction score and average rating for the chosen period, and a table of all ratings with model, date, serial number and session, which you can filter. Each rating links to its model and charging station and shows the full comment.
The Models tab replaces the Model performance page.
Until now, ratings had their own Ratings page and the scoring methodology sat in the sidebar. Ratings now live on the User satisfaction tab, and the old Ratings page takes you there. The methodology opens as a dialog from the Performance header. There is nothing for you to set up: the new Overview replaces the old one for everyone who had it.
Why it matters
You can read how your hardware performs in the field and how drivers rate it on one page, and spot the models that need attention without building your own reports.
Who it's relevant for
Hardware manufacturers using the Hardware Portal. The operator breakdown and the User satisfaction tab are part of the Full tier.